The Gantt Charts
The Gantt Charts are where you see and manage your schedule visually in planeus.
In planeus, there are two Gantt chart views for mutiple levels of planning:
- Manufacturing Plan
- Timeline
You can find them as two seperate tabs in the Planning Modules.
Manufacturing Plan View
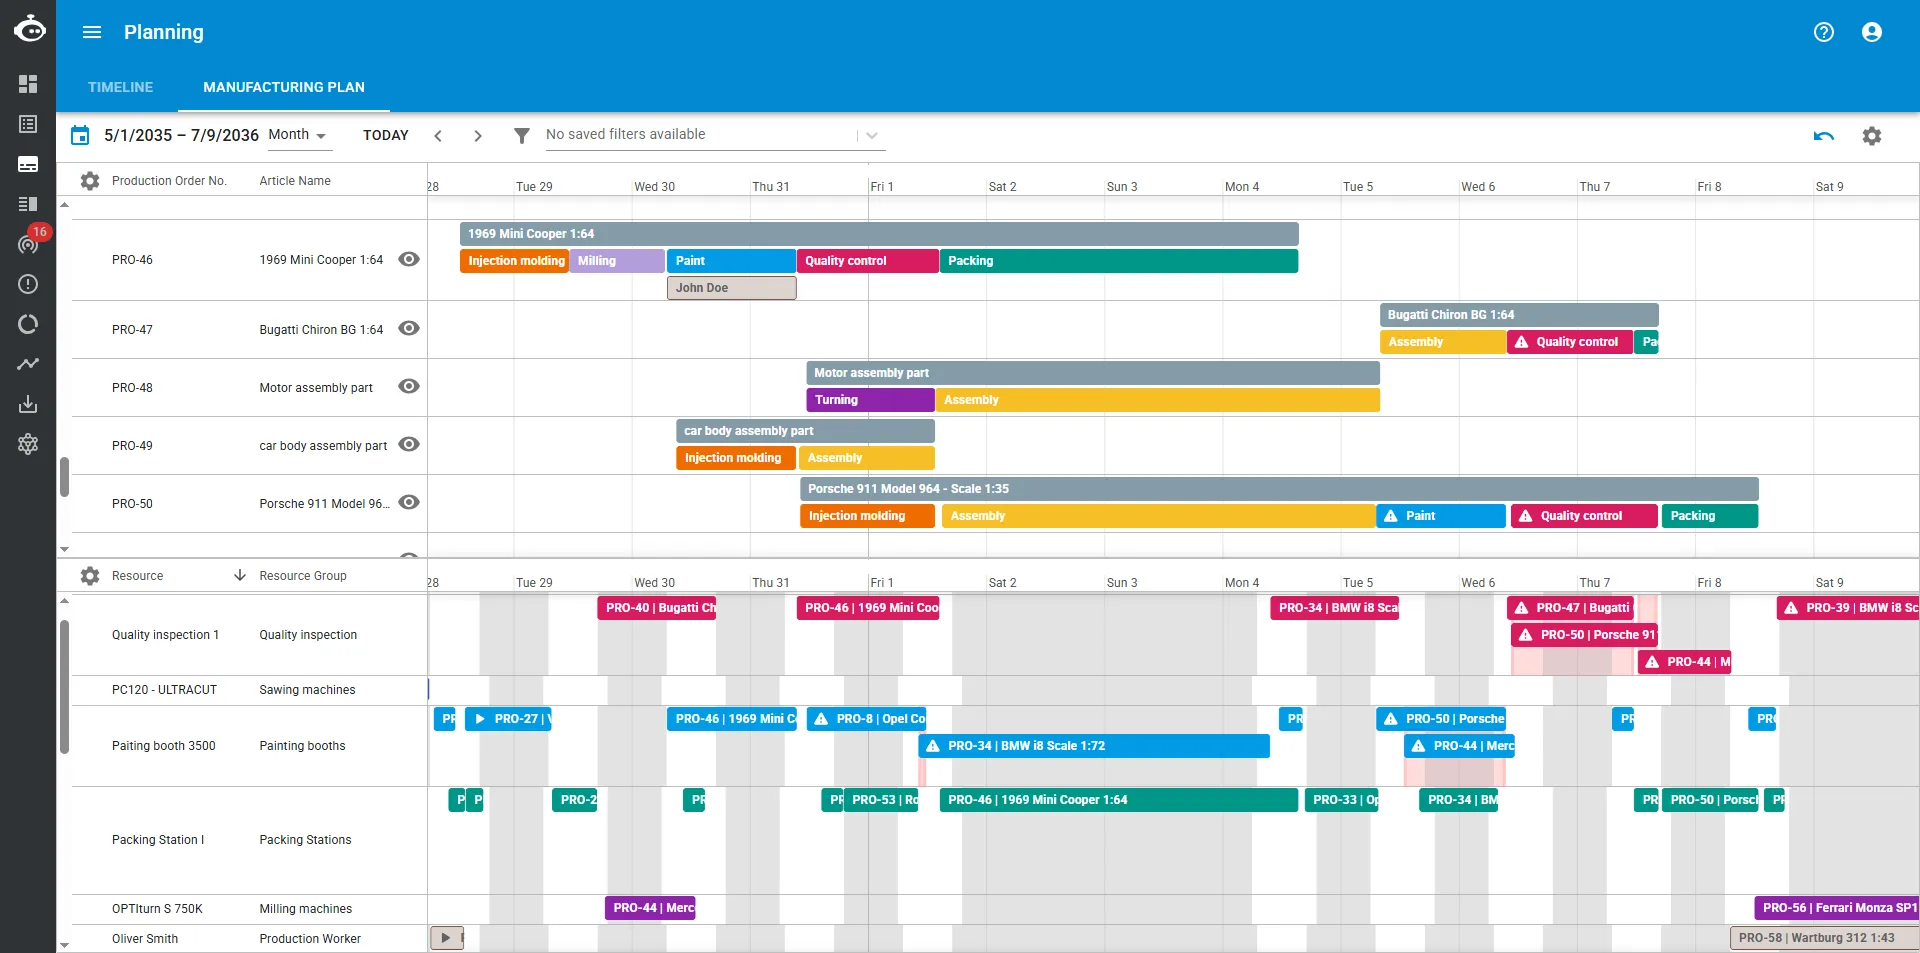
The Manufacturing Plan View is where you dig into the details of your past. current, and future operation schedule. It focuses on what happens on the shop floor. Despite the name, it is suitable for various type of operations outside manufacturing.

How it’s organized
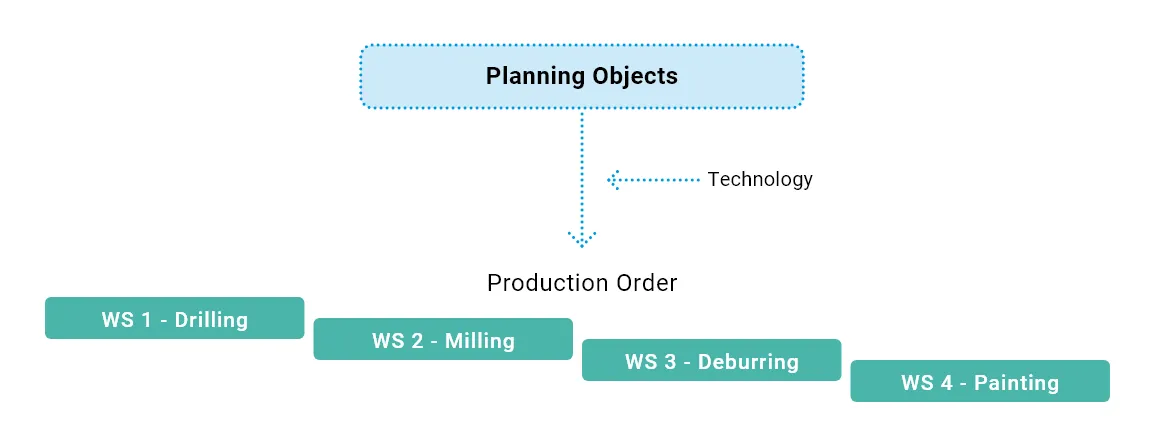
In the Manufacturing Plan View, we plan on the Work Step and Technology level. On this level, the focus is on the Work Steps that are involved in the production process.
Work Steps are generated automatically based on the Technology linked to the article in the Order Item.
And Work Step will always tie to Resources.
In this view, there are two smaller, interactive Gantt charts. By clicking on the Gear icon on the top right corner, you can select which chart chart to be shown:
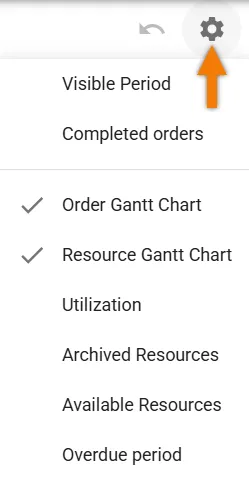
Order Gantt Chart
Looking into your schedule by Production Order can help you follow the paths through production.
Good for checking:
- All your scheduled Order Items and their Work Steps needed to make them.
- The timing and sequence of all schedule Work Steps.
Example: You’re producing 100 metal parts for a customer. In Orders View, you see:
- Cutting → Drilling → Polishing → Inspection
- Each step lined up for that specific order.
Resource Gantt Chart
Shows your schedule and by Resource (machines, people, tools) and helps you check how busy each resource is.
Good for checking:
- How each Work Step is assigned to each Resource, like machines or people.
- The planned sequence / time table of that Resource.
Example: You click on your CNC Machine and see:
- It’s booked for a Work Step from 8 AM to 10 AM.
- It’s free from 10 AM to noon.
- It’s booked again for another Work Step from noon to 3 PM.
How the Order and Resources Gantt charts work together?
- Click on a Work Step in Orders Gantt chart
- It'll be highlighted in Resources Gantt chart (and vice versa).
- Everything else fades out so you can focus on the job you selected.
Timeline View
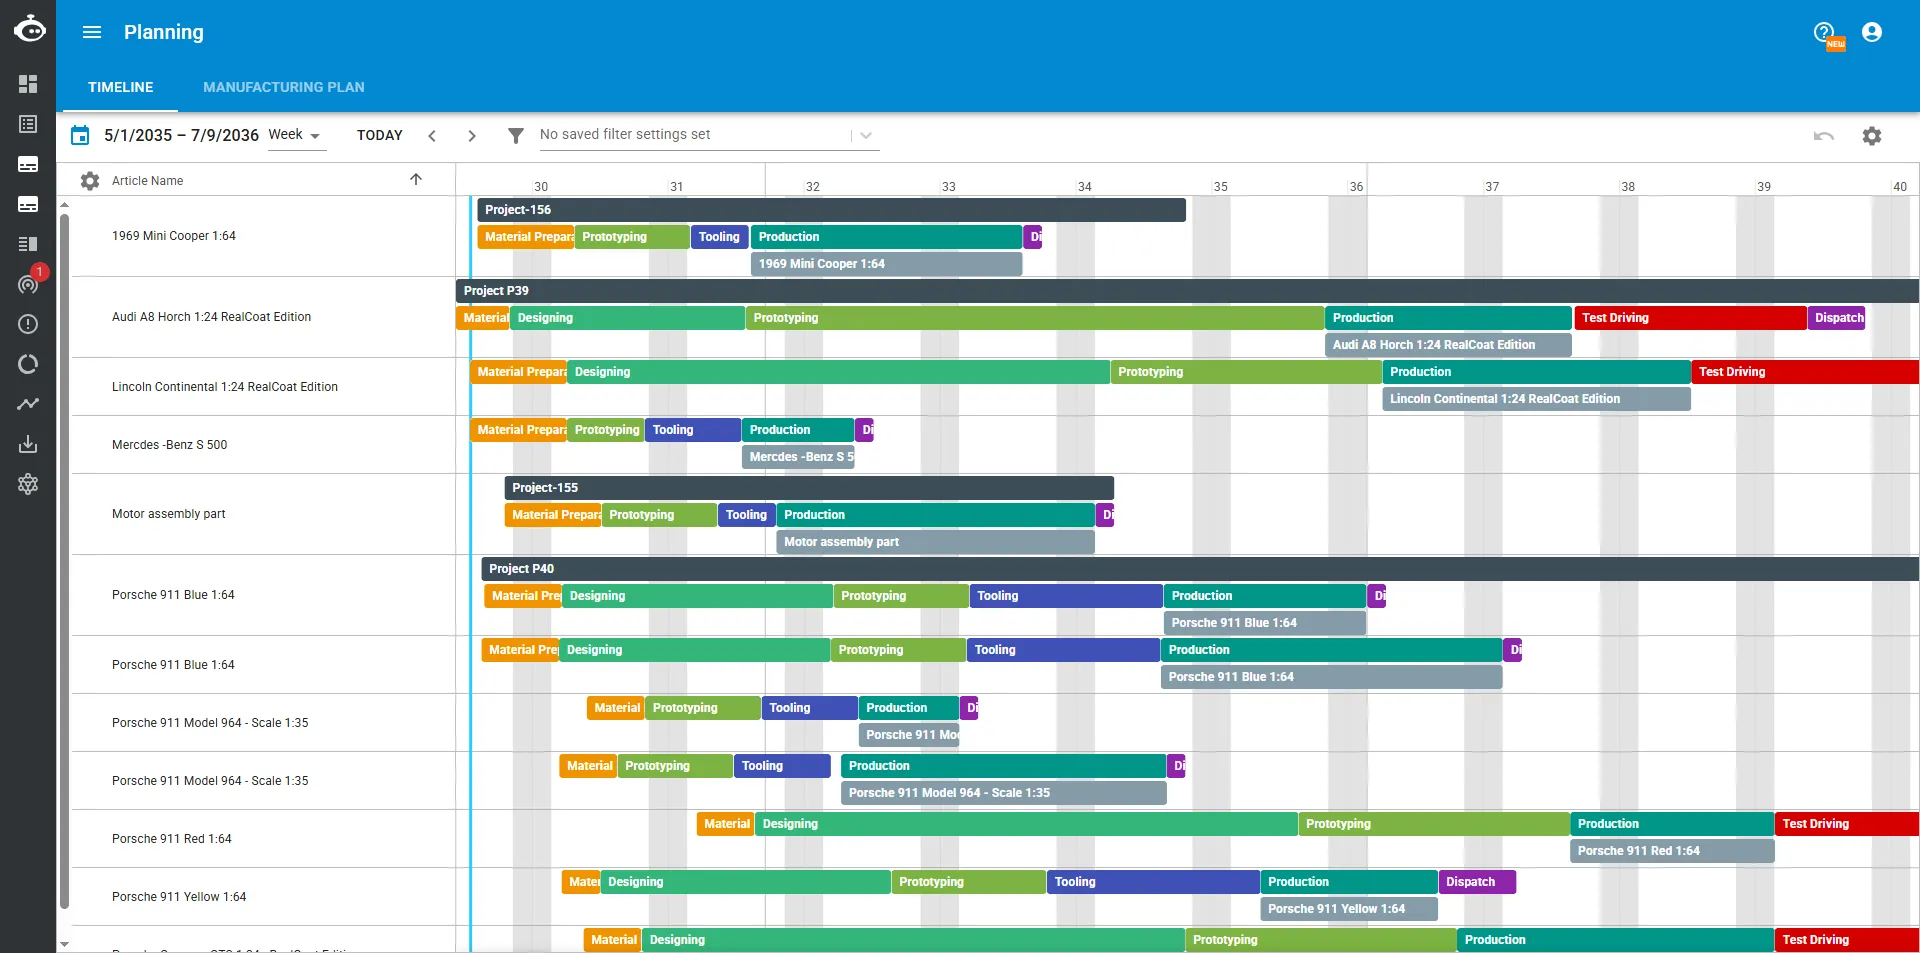
The Timeline View gives you a macro, big-picture look at your entire project from start to finish. It’s best for managing everything that happens before, during, and after production.
What you see
- Your Project as a top-level bar on the timeline.
- All the Processes connected to your project listed underneath.

What are Processes?
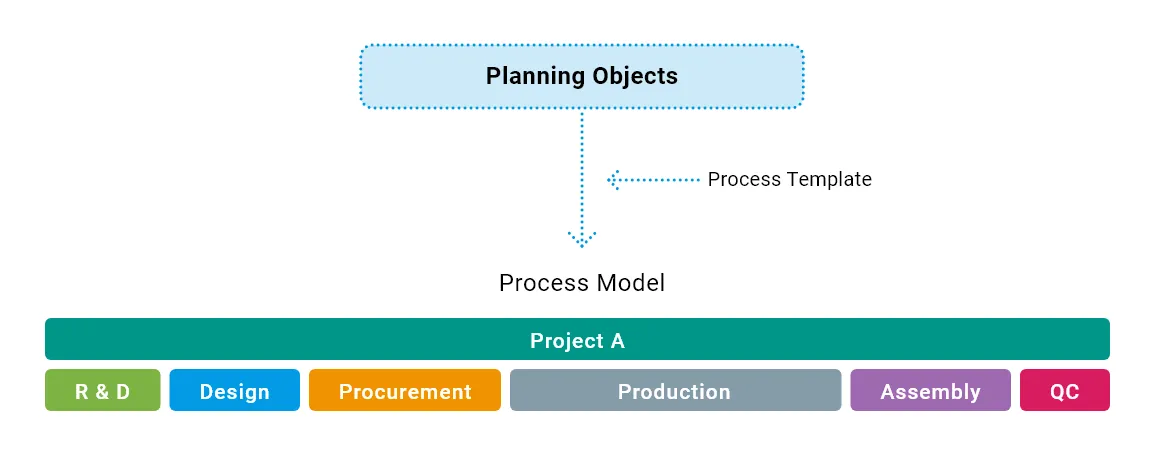
Processes are steps that happen above, or outside the core operations.
For example:
- Planning & Engineering: Designing a new product.
- Purchasing: The supply shippment time.
- Production: Entire Production process itself also counts as a Process
- Quality Checks: Inspections before production starts.
- Shipping & Logistics: Preparing finished goods for delivery.
- Documentation: Creating manuals or labels for products.
Why use Timeline View?
planeus focuses on operations, but we know that the big picture matters too. Using the Timeline View, it helps you to:
Track the Entire Project
- See how processes outside your core operation would shift your schedule forward or backward in time.
Identify Bottlenecks Early
- Spot delays in planning, purchasing, or approvals that might affect your production start.
Coordinate Teams
- Keep departments like engineering, procurement, and logistics on the same page.
Further Integrations
- Let your external system to trigger status changes (e.g., supply chain management updates) and automatically update the Timeline in planeus.
Example
Suppose you’re building a new custom machine for a customer. In Timeline View, you might see:
- A process for Design & Approval from the engineering team.
- A process for Ordering Special Parts from suppliers.
- A Production Process linked to manufacturing the machine.
- A process for Packing and Shipping to the customer.
Everything appears on the same timeline, so you can easily check if you’re on track for delivery.